Recent results: Arrival directions
For harmonic analysis of the right ascension distribution of arrival directions the EAS events at E>0.1 EeV are selected with criteria: axes within array area; zenith angles q<600; each of three neighboring stations forming a ‘trigger’ triangle with a side of 500 m has the particle density r≥1. This leads to double reduction of the number of events below 1 EeV.
It should be noted that in this energy region the observed distribution is affected by the inhomogeneity of the sky survey during the diurnal cycle and seasonal variations of atmospheric conditions. That is why the special correction method was used in the first two lowest energy intervals.
Table lists the results of harmonic analysis. There is no anisotropy in the energy intervals except 10-30 EeV where we found a significant (~3s) first harmonic amplitude in the right ascension: A1=26.4±8%, j1=2.3±1.2h. Reducing log10E interval twice or to quarter doesn’t eliminate the anisotropy. It remains if we divide an observation period into two equal parts as well.
| Energy bins, lgE, eV | Event number | A1, % | dA1, % | j1,
hrs |
dj1
hrs |
p(>A1) | Observation period |
| 17.0-17.5 | 147314 | 0.5 | 0.5 | 21.1 | 3.8 | 0.399 | May1982-May2000 |
| 17.5-18.0 | 88208 | 1.1 | 0.7 | 23.6 | 2.4 | 0.069 | May1982-May2000 |
| 18.0-18.5 | 27301 | 0.7 | 0.9 | 22.7 | 4.6 | 0.712 | Jan1974-May2000 |
| 18.5-19.0 | 3250 | 3.6 | 2.5 | 2.9 | 2.7 | 0.355 | Jan1974-May2000 |
| 19.0-19.5 | 312 | 26.4 | 8.0 | 2.3 | 1.2 | 0.004 | Jan1974-May2000 |
| > 19.5 | 37 | 6.8 | 23.2 | 6.3 | 13.1 | 0.959 | Jan1974-May2000 |
In order to reveal the area on the sky where an excess flux is located we have used the wavelet analysis which has been already demonstrated to be going on well in many applications in various scientific fields. The continuous isotropic wavelet transform of the observed distribution in equatorial coordinates is convenient to search for large-scale anisotropy in arrival direction distribution. The wavelet analysis is a logical evolution of the harmonic analysis which is effective for determination of the local features of aperiodic functions. The method, as well as the harmonic analysis, is based on the expansion of an original function in an orthonormal basis, but wavelets, in contrast to harmonic functions, are localized in both physical and Fourier transform spaces.
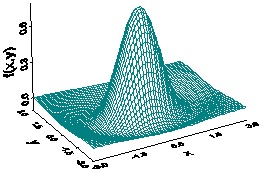
The deviation of the observed-to-expected amplitude ratio of the wavelet coefficient from 1 can be used as a measure of deviation from the isotropic expectation. The most appropriate in this case is the Marr wavelet (‘Mexican hat’); 2-dimensional version is illustrated in Fig. 1.
An expected declination spread of isotropic arrival directions is sufficiently non-uniform due to array acceptance. So we have calculated the wavelet transform as a sum of delta functions in both cases: for observed and expected isotropic distribution of N equatorial angles in each energy bin. Expected one is averaged over a sample of 1000 trials. To estimate the dispersion of the transform, (wvmax-wvmin)/(wvmax+wvmin), the first harmonic amplitude in right ascension was used. Resulting observed/expected ratio is given in Fig. 2. There is an energy bin, 10-20 EeV, where the observed amplitude is significantly greater than isotropic one: wvobserved/wvisotropic=2.83±0.51; the maximum coordinates are α=(2.3±1.3) h; δ=52.50±7.50; scale parameter 100<R<200. When R<100 there is no statistically significant deviation from the isotropic expectation in all energy/angular bins.
As it was shown above, the first harmonic amplitude of the Yakutsk array data distribution in right ascension sufficiently deviates from the expected-for-isotropy value in the vicinity of E=10 EeV. Presumably, the transition region from Galactic to extra-galactic CRs is somewhere below this energy.
As was shown earlier, cosmic rays originating in the Galactic disk have two distinctive features in their arrival directions – galactic plane enhancement and north-south asymmetry – which can be used to detect the Galactic CR contribution to the primary flux in the transition area. An analysis of the UHECR Galactic latitude distribution observed with the Yakutsk EAS array was used to estimate the probable fraction of Galactic protons and nuclei in the primary beam. Indeed, the results show a southern excess in the region 5-20 EeV where the deviation of the North-South asymmety parameter from the value expected in the isotropic case is 3.5s, while the galactic plane enhancement parameter indicates no significant deviation from the situation for no asymmetry.
Our finding with wavelet analysis confirms these hints, and is further strengthening the evidence of the anisotropy in arrival directions of UHECRs detected with the Yakutsk array in the interval 10<E<20 EeV.
Due to space localization of the Marr wavelet we can point out a sky area where an excess UHECR flux is detected in our data in the particular energy range. The corresponding scale parameter of the wavelet is limited within 100<R<200. It should be noted that an upper limit is due to applicability restriction of the wavelet on equatorial sphere, rather than the data distribution feature.
The anisotropy in arrival directions revealed in the Yakutsk array data by three different methods of data handling can be attributed to non-zero galactic nuclei fraction. These nuclei of average charge ~10 can amount up to 10% of the primary isotropic flux at energy E~10 EeV. In this case the hypothesis is congruent to other indications given by giant arrays of the excess flux of nucleons from galactic plane/center at E~1 EeV.